Introduction
Background
Emotion recognition has emerged as a pivotal task in the field of computer vision, with applications ranging from social robots to mental health diagnostics [1]. By analyzing facial expressions, emotion recognition systems enable machines to understand human emotions in real-time, fostering more natural and empathetic interactions. These systems are also transforming industries such as healthcare, where robots are increasingly able to diagnose and monitor mental health conditions, alerting human doctors of emergencies before they occur [2].
One of the most innovative approaches in computer vision is the use of Vision Transformers (ViTs), which are based on the Transformer models that revolutionized natural language processing. In recent years, ViTs have been leveraged for computer vision tasks including high-level vision, image recognition, feature extraction, and video processing, performing similarly to or better than traditional convolutional and recurrent neural networks (CNN/RNN) [3]. Complementary to ViTs, computer vision tasks increasingly rely on patching, a technique where images are divided into smaller, fixed-size pieces (“patches”) in order to focus on individual regions, striking a balance between analyzing individual pixels (too localized) and the entirety of the image (too broad). Therefore, patching can provide more fine-grained analysis of an image while capturing local relationships [4].
Recent work has also experimented with clustering patches together in order to improve efficiency and group morphologically similar patches, thereby increasing the model’s understanding of the image [6]. Clustering algorithms for patches mimic the already well-known and common clustering methods used in machine learning, including: k-means clustering, spectral clustering, gaussian mixture models (GMMs), agglomerative hierarchical clustering, DBSCAN, and mean shift clustering [7].
Objective
Currently, ViTs utilize image patches as tokens for patch-to-patch attention. However, past work has shown a moderate increase in accuracy and decrease in complexity by clustering these patches together and using patch-to-cluster attention instead [5, 6]. This project investigates the impact of various patch clustering techniques on emotion recognition accuracy, using the AffectNet dataset as our primary benchmark. Our goal is to identify which clustering methodologies, and number of clusters, most effectively enhance emotion detection accuracy. As a secondary evaluation metric, we will be analyzing the trade-offs between recognition accuracy and time efficiency to understand which method is the most practical for real-world usage.
We hypothesize that different clustering approaches will yield varying levels of accuracy in identifying emotions, with non-spherical clusters likely outperforming others. We also anticipate that the optimal number of clusters will strike a balance, resulting in high recognition accuracy by not creating too many or too few groups of facial features (patches).
Approach
The model pipeline we use includes two main parts: a clustering algorithm to cluster image patches, and a Vision Transformer (ViT) utilizing patch-to-cluster attention for emotion recognition accuracy results. The patch-to-cluster attention mechanism and the ViT hyperparameters remain fixed throughout this project, while the clustering algorithm and number of clusters are changed in order to isolate the effects of different patch clusterings on accuracy. The novelty of our approach lies in integrating patch-to-cluster attention with multiple clustering techniques to determine which method is most effective for emotion recognition. Although patch-to-cluster has been implemented before with CNN clustering [5], we expand upon this work by comparing multiple clustering algorithms (K-Means, Spectral, and Agglomerative).
Dataset and Preprocessing
Dataset Description
The dataset used for this project is derived from the AffectNet Training Data, one of the largest datasets for facial emotion recognition. It provides labeled examples of human faces for eight primary emotions: Anger, Contempt, Disgust, Fear, Happiness, Neutral, Sadness, and Surprise.
AffectNet stands out due to its diversity, with faces captured in real-world environments under varying lighting, poses, and demographics. This makes it an ideal dataset for training models capable of generalizing across diverse conditions.
Challenges in the Dataset
Despite its richness, AffectNet presents significant challenges:
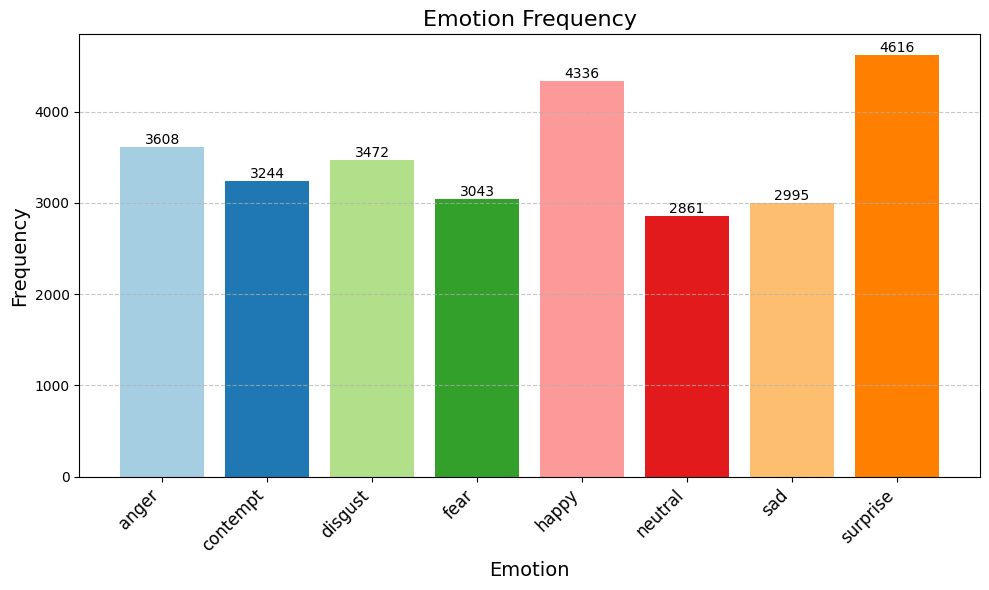
- Class Imbalance: Certain emotions like "Happiness" dominate the dataset, while others like "Disgust" are underrepresented.
- Variability: Differences in lighting, facial occlusions, and pose angles add noise to the dataset.
- Subjectivity: Emotions are inherently subjective, and labeling inconsistencies may arise across annotators.
Original Emotion Distribution
The original dataset exhibits a skewed distribution across emotion classes, as visualized in the chart below:
Balanced Dataset
To address the class imbalance, we balanced the dataset by subsampling 2,477 images per class, resulting in a total of 19,816 images. This ensures fair representation across all emotions and prevents the model from being biased toward overrepresented classes.
Example Images
Below are sample images from the dataset, showcasing one example from each emotion class, labeled for clarity:

Anger

Contempt

Disgust

Fear

Happiness

Neutral

Sad

Surprise
CNN Embeddings
We first ensured all images were indeed of size 96 by 96. After that we split the image into 36 patches of dimensions 16 by 16 each. Each image was now represented by 36 image patches.
As part of our methodolgy, we utilize a pretrained ResNet-50 model to generate 2048-dimensional feature embeddings for each image patch. These embeddings are extracted from the global average pooling layer of the network, which ensures compact and informative representations of visual features. These embeddings serve as the foundation for our clustering techniques.
Methods
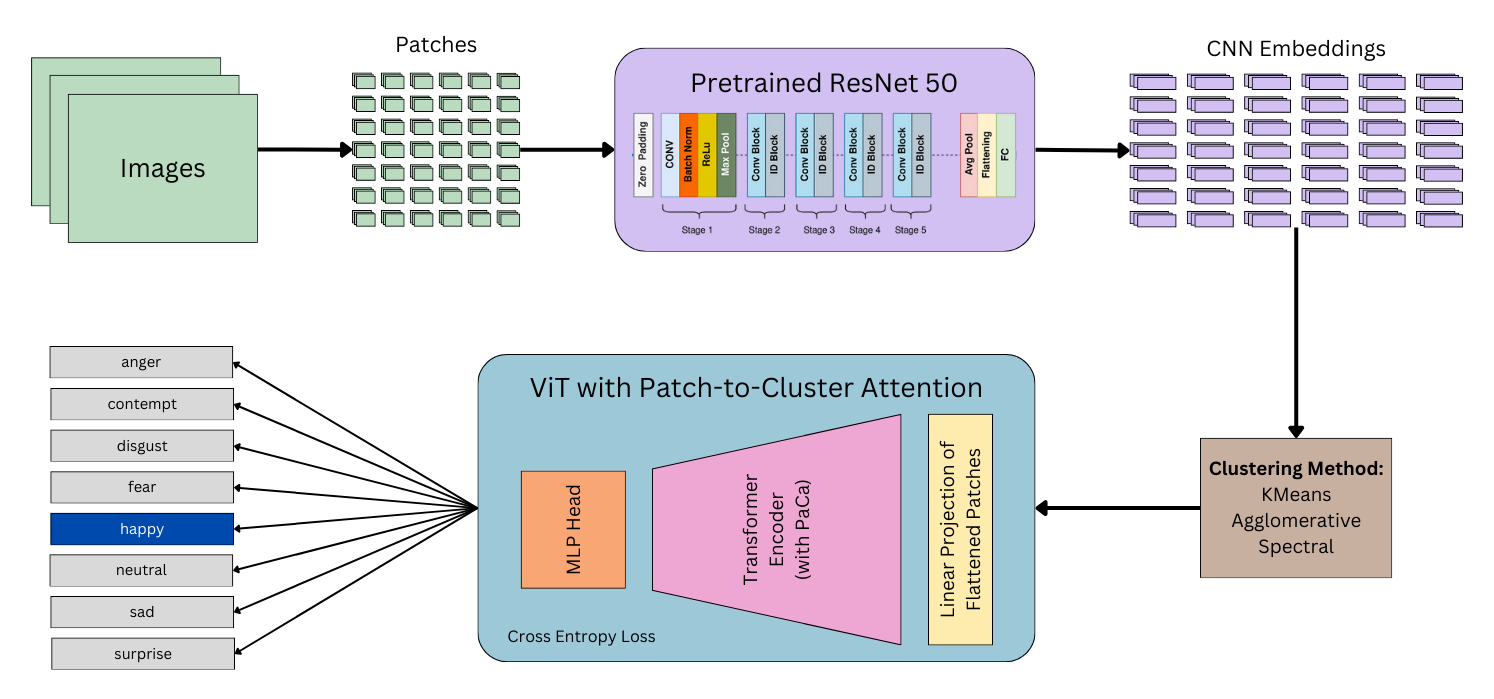
Vision Transformer Architecture
Vision Transformers (ViTs) adapt the traditional transformer model to make them applicable to computer vision tasks. Unlike convolutional neural networks, which rely on local receptive fields, ViTs divide images into fixed-size patches and treat them as a sequence of tokens which are linearly projected into an embedding space. The self-attention mechanism in ViTs then computes relationships between all pairs of patches (patch-to-patch attention). A learnable class token aggregates information from all patches, and its output is used for classification tasks. ViTs excel at capturing long-range dependencies and global patterns in image data, making them particularly effective for tasks requiring detailed contextual understanding.
A well known issue with patch-to-patch attention is that it suffers from quadratic complexity [5], since every query must interact with every key. Our architecture instead uses Patch-to-Cluster attention, where a predefined number of cluster assignments is first learned and then used in computing the key and value, resulting in linear complexity.
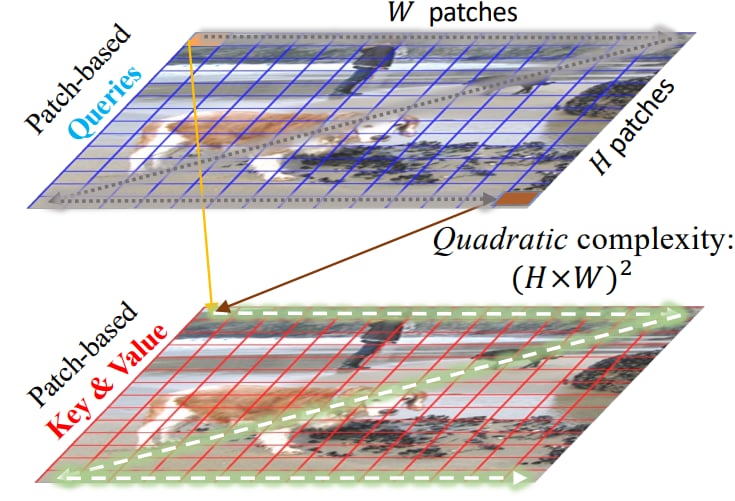
Figure 3a: Patch-to-Patch Attention [5]
(Traditional)
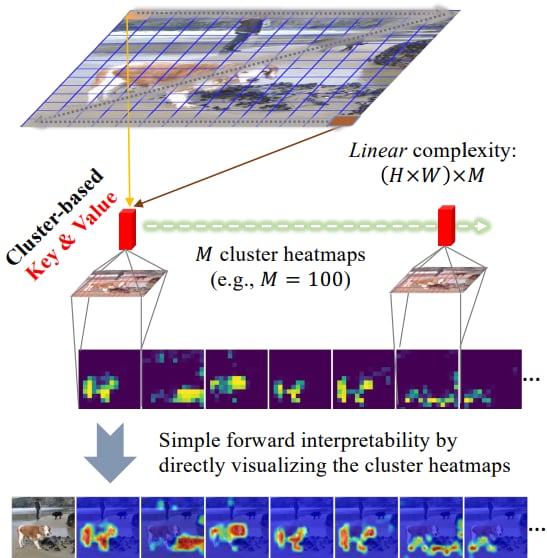
Figure 3b: Patch-to-Cluster Attention [5]
(What We Use)
Patch-to-Cluster Attention
Our attention mechanism operates as follows:
- Query, Key, and Value Projections: Patch embeddings are projected into query vectors (Q) using a linear layer. Cluster centroids, computed via a clustering algorithm, are projected into key (K) and value (V) vectors. These projections are used to calculate the relationships between patches and clusters.
- Attention Computation: Attention scores are computed using a scaled dot-product where N is the number of patches, C is the embedding dimensionality, and M is the number of clusters. \[ A_{N,M} = \text{Softmax}\left( \frac{Q_{N,C} \cdot K_{M,C}^T}{\sqrt{C}} \right)_{\text{dim}=1} \]
- Weighted Aggregation: The attention scores weigh the cluster value vectors (V). This step integrates global cluster-level information into the patch representations.
- Output: The aggregated patch representations are transformed via a linear output projection to produce the final enhanced patch embeddings.
Our model architecture diverges from the traditional Vision Transformer design by employing patch-to-cluster attention (See Figure 2).
Patch Clustering
We use the following clustering methods for the image patches [7]:- K-Means Clustering: iteratively partitions data into a predefined number of clusters by minimizing the variance within each cluster. Centroids are initialized randomly, and clusters are updated based on the distance of each data point to the nearest centroid. K-means is simple and computationally efficient, making it suitable for high-dimensional data. It is most effective for well-separated and spherical clusters.
- Agglomerative Clustering: starts with each data point as its own cluster and recursively merges the most similar clusters until a predefined number is reached. Notably, it is able to capture hierarchical relationships in the data and is also computationally efficient.
- Spectral Clustering: Spectral clustering constructs a similarity graph based on pairwise relationships between data points and performs eigenvector decomposition to embed the graph into a lower-dimensional space for clustering. It is known for handling complex, arbitrarily shaped clusters effectively. It is also suitable for datasets where clusters are not linearly separable.
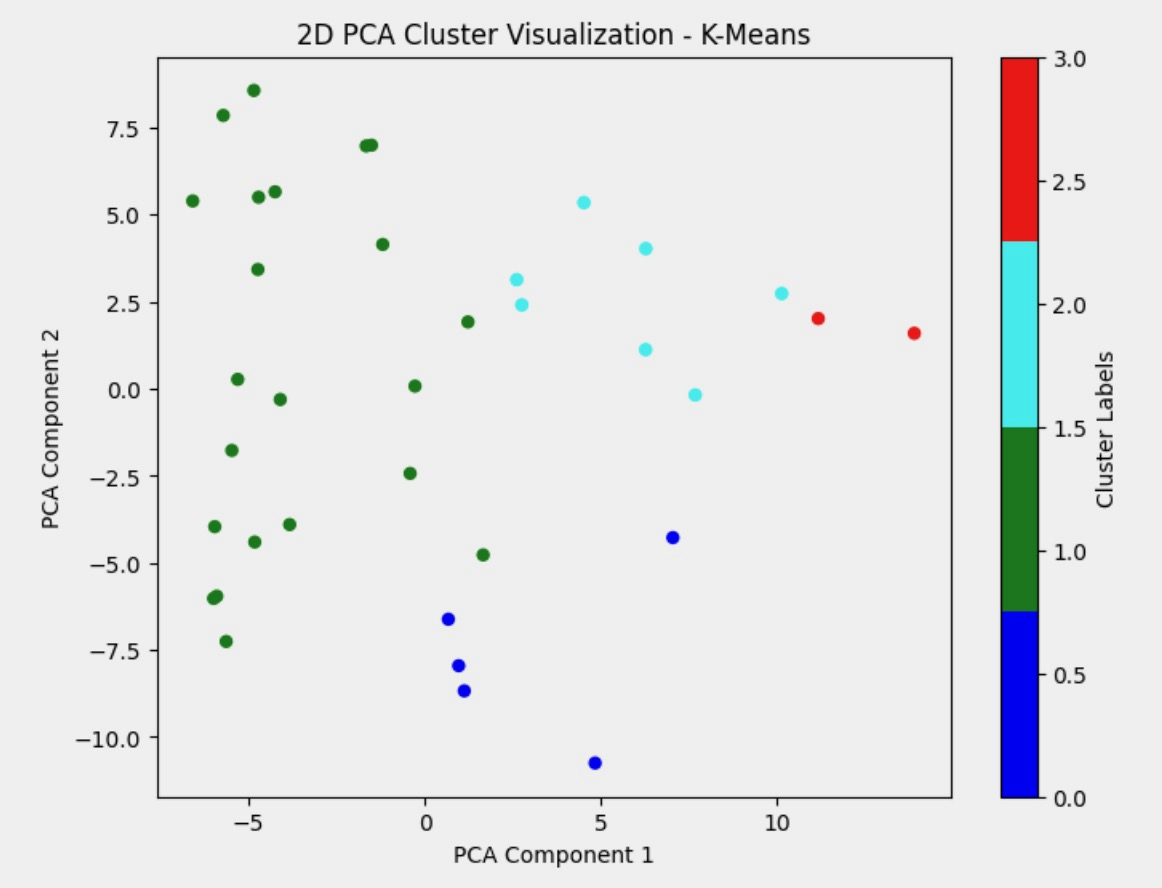
KMeans Clustering
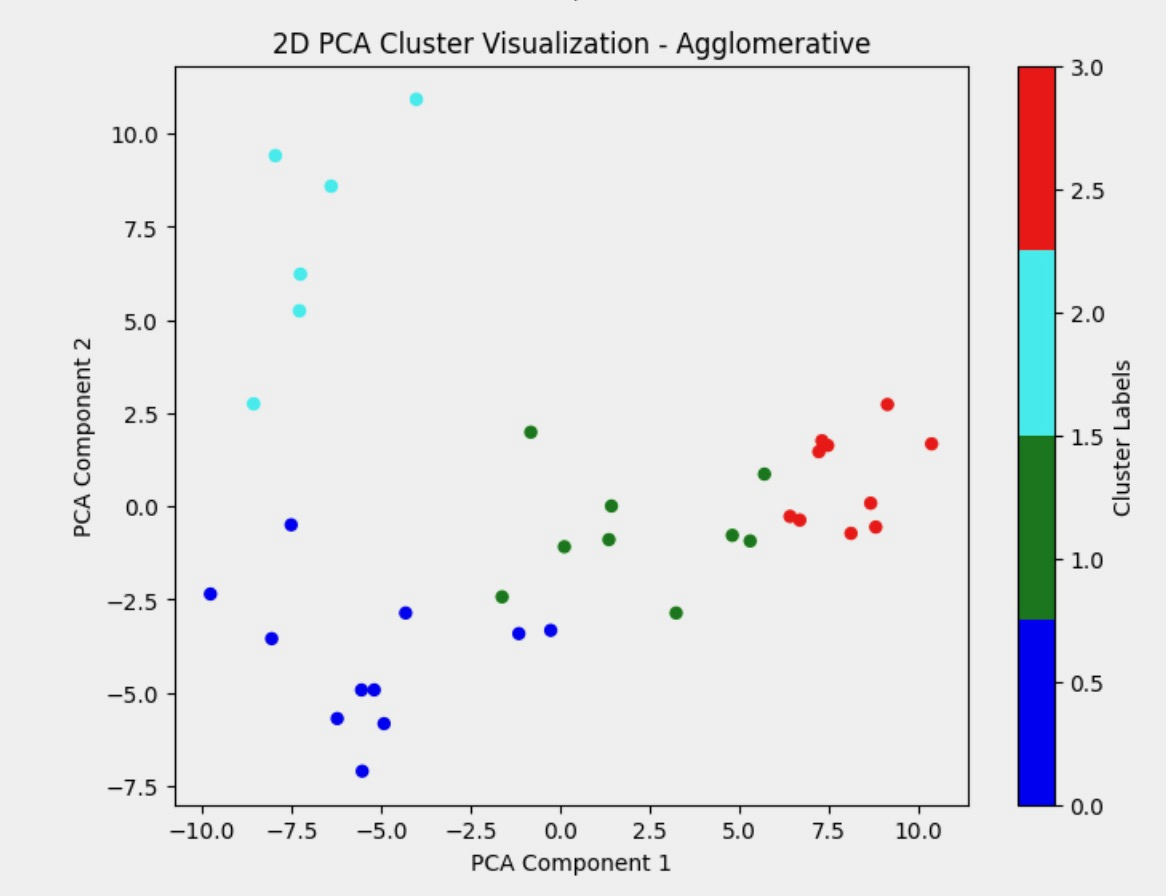
Agglomerative Clustering
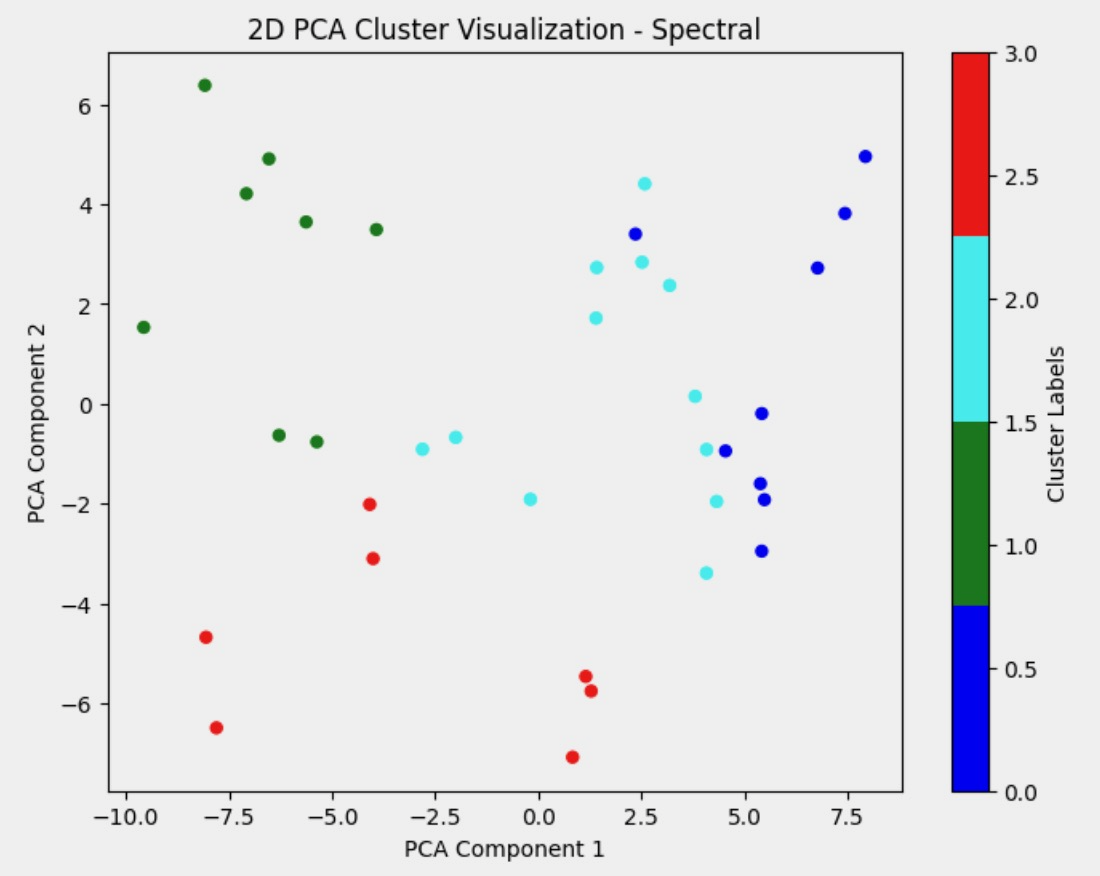
Spectral Clustering
Figure 4: PCA of Different Clustering Methods
Model Training
- Dataset and Preprocessing: The dataset is split into training and testing sets, with 80% of the data used for training and 20% for testing.
- Training Setup: We train our model with the Adam optimizer using a learning rate of 1e-3, CrossEntropyLoss, a depth of 6, and 30 epochs of training.
- Device: Model training is done on Google Colab A100 GPU.
Experiments and Results
Experimental Setup
We analyze the classification accuracy of our model across three clustering methods (K-means, spectral, and agglomerative) and three cluster sizes (2, 4, and 8). We evaluate the classification accuracies of our models on the AffectNet test set. We also evaluate the time complexity of each clustering method to better understand the tradeoff between accuracy and computational costs.
Results
| Clusters | KMeans | Agglomerative | Spectral |
|---|---|---|---|
| 2 | 33.65% | 28.71% | 44.00% |
| 4 | 26.46% | 41.42% | 38.75% |
| 8 | 31.76% | 25.38% | 33.00% |
Our results reveal significant differences in performance among the clustering methods across cluster sizes (k). At k=2, Spectral Clustering performed the best, likely due to its ability to capture non-linear relationships. At k=4, Agglomerative Clustering achieved the highest accuracy, possibly because its hierarchical nature allows it to merge smaller, similar clusters into larger, meaningful groupings that align well with moderate granularity. At k=8, K-Means improved slightly, while Spectral Clustering and Agglomerative Clustering both dropped, probably due to creating overly fragmented groupings that lacked coherence. Overall, Spectral Clustering showed strong performance at lower cluster sizes, Agglomerative Clustering excelled at moderate clusters, and K-Means displayed consistent, albeit lower, performance across all configurations. These results highlight the importance of choosing the right clustering method and cluster size for optimizing accuracy.
The runtime comparison of the clustering methods reveals notable differences in computational efficiency. When analyzing time complexity, we ran each clustering algorithm on 5000 embeddings (roughly ¼ of our dataset) and found that K-Means takes 21 seconds, Agglomerative takes 14 seconds, and Spectral takes 119 seconds. Agglomerative clustering was the fastest, with K-Means close behind. Spectral clustering, however, was extremely computationally expensive. Spectral Clustering, while effective at capturing non-linear relationships, is significantly slower than the other methods, which could be a bottleneck for larger datasets or real-time applications. Agglomerative Clustering seems to demonstrate the best balance between accuracy and runtime at k = 4, making it a strong choice for tasks prioritizing speed and hierarchical insights. K-Means remains a good middle-ground option, offering moderate runtime and competitive accuracy, particularly as the number of clusters increases.
Conclusion and Future Works
In this project, we explored multiple clustering techniques—KMeans, Agglomerative Clustering, and Spectral Clustering—to evaluate their performance and efficiency in the context of patch-based emotion recognition. Our results highlighted the trade-offs between clustering quality and computational efficiency. While Agglomerative Clustering demonstrated the best runtime performance, KMeans and Spectral Clustering offered better accuracy under certain conditions.
We initially considered using Gaussian Mixture Models (GMMs) due to their probabilistic approach to clustering, which assumes embeddings are drawn from a mixture of Gaussian distributions. The Expectation-Maximization (EM) algorithm, a core component of GMMs, provides a powerful mechanism to estimate cluster parameters. However, due to time constraints and the computational complexity of GMMs when applied to large datasets like ours, we chose to omit this method from our final implementation. Future exploration into GMMs, particularly with optimized frameworks or smaller subsets of embeddings, may reveal their potential in capturing subtle patterns in the data.
Future Directions
- Exploration of GMMs: Investigating the viability of GMMs using optimized algorithms or smaller embedding subsets to mitigate computational costs.
- Other Clustering Techniques: Exploring advanced clustering algorithms, such as DBSCAN or hierarchical variations, to better adapt to the dataset's characteristics.
- Parameter Tuning: Experimenting with key hyperparameters, including the number of transformer heads, depth of the architecture, and attention mechanisms, to optimize clustering performance.
- Larger Number of Clusters: Investigating how models perform when using a larger number of smaller clusters to capture finer-grained patterns in the data.
- Multi-Modal Extensions: Combining visual embeddings with other modalities, such as audio or text, to enhance the emotion recognition pipeline.
This work establishes a strong foundation for leveraging clustering methods in vision tasks, with room to integrate advanced clustering techniques and additional modalities in future studies.
Acknowledgements and References
We would like to express our heartfelt gratitude to Professor Isola, Professor Beery, and Dr. Bernstein and the course staff of 6.7960 for their invaluable guidance, feedback, and support throughout this project. Their insights and expertise have been instrumental in shaping our understanding and execution of this work.
- [1] Younis, E.M.G., Mohsen, S., Houssein, E.H. et al. Machine learning for human emotion recognition: a comprehensive review. Neural Comput & Applic 36, 8901–8947 (2024). https://doi.org/10.1007/s00521-024-09426-2
- [2] M. Dhuheir, A. Albaseer, E. Baccour, A. Erbad, M. Abdallah and M. Hamdi, "Emotion Recognition for Healthcare Surveillance Systems Using Neural Networks: A Survey," 2021 International Wireless Communications and Mobile Computing (IWCMC), Harbin City, China, 2021, pp. 681-687, doi: 10.1109/IWCMC51323.2021.9498861.
- [3] Kai Han, Yunhe Wang, Hanting Chen, Xinghao Chen, Jianyuan Guo, Zhenhua Liu, Yehui Tang, An Xiao, Chunjing Xu, Yixing Xu, et al. A survey on visual transformer. arXiv preprint arXiv:2012.12556, 2020.
- [4] Trockman, A., & Kolter, J. Z. Patches are all you need?. arXiv preprint arXiv:2201.09792, 2022.
- [5] R. Grainger, T. Paniagua, X. Song, N. Cuntoor, M. W. Lee and T. Wu, "PaCa-ViT: Learning Patch-to-Cluster Attention in Vision Transformers," 2023 IEEE/CVF Conference on Computer Vision and Pattern Recognition (CVPR), Vancouver, BC, Canada, 2023, pp. 18568-18578, doi: 10.1109/CVPR52729.2023.01781.
- [6] Y. Shen, Y. Lu, Y. Luo and J. Ke, "Cluster Image Patches with Multiple Mutual Information in Unlabelled Whole-Slide Image," 2021 IEEE International Conference on Bioinformatics and Biomedicine (BIBM), Houston, TX, USA, 2021, pp. 1509-1512, doi: 10.1109/BIBM52615.2021.9669810.
- [7] Nazeri, S. (2023, July 19). Comparing the-state-of-the-art clustering algorithms. Medium.